Environment Data
ORIX Group Environmental Performance Data
CO2 Avoided Emissions through the Renewable Energy Business
| FY ended March 31, 2022 |
FY ended March 31, 2023 |
FY ended March 31, 2024 |
FY ended March 31, 2025 |
|
|---|---|---|---|---|
| Wind Power Generation | 1,670 | 2,155 | 2,336 | 2,200 |
| Solar Power Generation | 1,297 | 1,425 | 1,553 | 1,710 |
| Geothermal Power Generation | 640 | 477 | 285 | 291 |
| Hydropower Generation | 428 | 406 | 327 | 416 |
| Biomass Power Generation | 254 | 198 | 259 | 266 |
| Total | 4,289 | 4,661 | 4,761 | 4,883 |
| Calculation Period | From April 1 to March 31 each fiscal year |
|---|---|
| Calculation Scope | ORIX Group Companies in Japan and overseas (including affiliated companies) |
| Basic Concept |
|
| Other | For biomass power generation data in the United States, the biogas capacity (unit: BTU) was converted to kWh. |
ORIX Group’s CO2 Avoided Emissions for Past Years*
| FY ended March 31, 2018 |
FY ended March 31, 2019 |
FY ended March 31, 2020 |
FY ended March 31, 2021 |
||
|---|---|---|---|---|---|
|
Environment and Energy Business |
Wind Power Generation | 573,100 | 739,900 | 1,157,900 | 1,324,000 |
| Solar Power Generation | 428,700 | 499,900 | 540,900 | 720,000 | |
| Geothermal Power Generation | 544,700 | 1,073,600 | 949,500 | 845,400 | |
| Hydropower Generation | 0 | 0 | 88,800 | 112,500 | |
| Biomass Power Generation | 46,000 | 43,000 | 43,700 | 241,400 | |
| Electricity Supply | 0 | 0 | 31,500 | 49,500 | |
| ESCO Services | 93,700 | 93,500 | 100,800 | 118,800 | |
| Other Environment and Energy Business | 700 | 800 | 100 | 22,300 | |
| Auto Business | 142,200 | 157,000 | 171,100 | 188,100 | |
| Other businesses | 7,700 | 10,800 | 9,100 | 5,500 | |
| Total | 1,836,800 | 2,618,500 | 3,093,400 | 3,627,500 | |
- Calculation scope includes only the renewable energy business from the fiscal year ended March 31, 2022 onwards. Also, emissions factors have been reviewed.
Please see below for scope and concept of calculation for past years.
- Scope and concept of calculation for past years
-
Calculation Period From April 1 to March 31 each fiscal year Calculation Scope ORIX Group Companies in Japan and overseas (including affiliated companies) Basic Concept - Calculations are performed by multiplying the reduced amount of activity among customers or society as a whole due to ORIX Group’s business activities by CO2 emissions factors.
- For calculation of business activities in Japan, in principle the emissions factors we use are “alternate values” under the Greenhouse Gas Emissions Accounting, Reporting, and Disclosure System (Act on Promotion of Global Warming Countermeasures).
Emissions Factors
FY2018.3 0.000512 t-CO2/kWh
FY2019.3 0.000500 t-CO2/kWh
FY2020.3 0.000488 t-CO2/kWh
FY2021.3 0.000470 t-CO2/kWh - For calculation of overseas business activities, in principle, we use emissions factors from each country.
- Calculations also include CO2 reduction credits redeemed during the calculation period after being acquired by ORIX Group.
- We calculated CO2 avoided emissions based on our ownership ratio.
ORIX Group's Energy Consumption and GHG Emissions
- Energy Consumption
| Energy Type | FY 2025 | FY 2026 | |
|---|---|---|---|
| Electricity | Purchased electricity and internal consumption from on-site generation facilities | 346 | 397 |
| Heat | Non-industrial steam, Cold Water, Hot Water | 43 | 50 |
| Fossil Fuels | Thermal coal, Heavy oil, diesel , Gasoline, City Gas, LPG, CNG, etc. | 2,806 | 2,739 |
| Biofuels | Biomass (wood) and Biogas | 1,304 | 1,203 |
| Total | 4,500 | 4,389 | |
[Notes]
1: Biomass (wood) is calculated on a dry weight basis.
2: From FY 2026, energy consumption associated with electricity purchased from intra-Group power generation companies was deducted.
(We deducted 4.9 GWh in FY 2026.)
| Energy Consumption from Renewable and Non-renewable | FY 2025 | FY 2026 |
|---|---|---|
| Renewable Energy | 1,408 | 1,369 |
| Non-Renewable Energy | 3,092 | 3,020 |
[Notes]
1. Renewable energy: Non-fossil energy derived from sources such as solar power, geothermal energy, biomass, biogas, and waste.
Electricity purchased from renewable energy sources.
2. Non-renewable energy: Energy other than renewable energy.
| Calculation Period | From April 1 to March 31 of each fiscal year |
|---|---|
| Calculation Boundary | Consolidated ORIX Group companies (Japan and overseas, excluding some companies where energy consumption are not considered material) |
| Calculation Method |
|
Scope of Assurance
The energy consumption for FY 2026 has been subject to limited third-party assurance by KPMG AZSA Sustainability Co., Ltd. For further details, please refer to the “Third-Party Assurance Information of Total Energy Consumption for the Fiscal Year Ended March 31, 2026."
| FY 2026 |
|---|
- Scope 1 & 2 GHG Emissions
| FY 2022 | FY 2023 | FY 2024 | FY 2025 | FY 2026 | |
|---|---|---|---|---|---|
| Scope 1 | 1,044,892 | 981,519 | 991,233 | 942,714 | 894,974 |
| Scope 2 | 151,980 | 139,766 | 137,525 | 121,591 | 110,364 |
| Scope 1&2 Total | 1,196,872 | 1,121,285 | 1,128,757 | 1,064,305 | 1,005,338 |
| Scope 1 | (Direct GHG emissions occurring from sources that are owned or controlled by the company (fuel consumption, industrial processes)) Combustion of fuels including fuel oil, diesel, gasoline, city gas, coal, biomass and waste; use of limestone for desulfurization treatment |
| Scope 2 | (Indirect GHG emissions from purchased energy consumed by the company (electricity use and heat)) Electricity use and heat (steam, cold water, hot water) |
| Calculation Period | From April 1 to March 31 each fiscal year |
|---|---|
| Calculation Boundary | FY 2022: Consolidated ORIX Group companies (Japan and overseas, excluding a limited number of overseas offices) FY 2023 - FY 2026: Consolidated ORIX Group companies (Japan and overseas, excluding some companies where GHG emissions are not considered material) |
| Target Activities | GHG Protocol direct emissions (Scope 1) and indirect emissions (Scope 2) |
| Calculation Method |
|
[Notes]
・ Change in emissions factors: Beginning from the data for FY 2022, we have changed the calculation for emissions related to electricity consumption to the market-based method.
・ Emissions from coal-biomass co-fired power plants: ORIX operates two coal-biomass co-fired power plants in Japan. One is Soma Coal and Biomass Power Plant in Soma City, Fukushima Prefecture, which started operations in March 2018. The other is Hibikinada Coal and Biomass Power Plant in Kitakyushu City, Fukuoka Prefecture, which started operations in December 2018. Each of these power plants has a total generating capacity of 112MW. Emissions from these two plants for FY 2026 were 789 thousand t-CO2e.
・GHG emissions quantification is subject to uncertainty when measuring activity data, determining emission factors, and considering scientific uncertainty inherent in the Global Warming Potentials.
| FY 2026 |
|---|
| FY 2025 | |
|---|---|
| FY 2024 | |
| FY 2023 | |
| FY 2022 | |
| FY 2021 | |
| FY 2020 | |
| FY 2019 | |
| FY 2018 | |
| FY 2017 |
| Scope 3 | (Value Chain GHG Emissions) and ORIX’s Businesses |
FY ended March 31, 2025
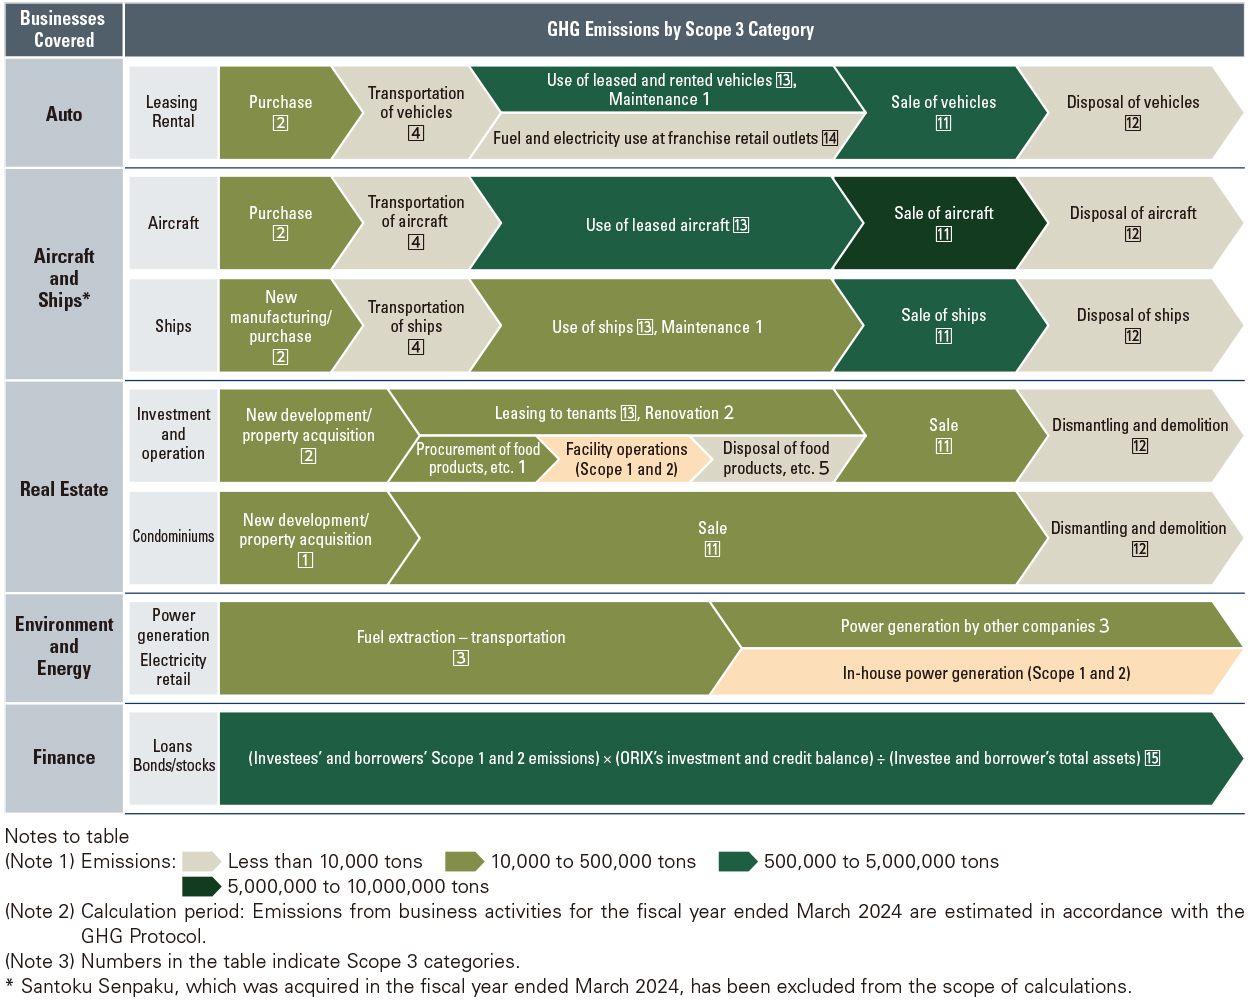
Emissions for categories other than those listed above are as follows.
| FY ended March 31, 2023 | FY ended March 31, 2024 | FY ended March 31, 2025 | |
|---|---|---|---|
| Category 6 (Business travel) | 39 | 49 | 50 |
| Category 7 (Employee commuting) | 4 | 5 | 5 |
| Calculation Period | From April 1 to March 31 each fiscal year |
|---|---|
| Calculation Boundary | Consolidated ORIX Group companies |
| Calculation Method |
|
| FY ended March 31, 2025 | Independent Assurance Statement from LRQA Limited |
|---|---|
| FY ended March 31, 2024 FY ended March 31, 2023 |
Independent Assurance Statement from LRQA Limited |
| FY ended March 31, 2024 | |
|---|---|
| FY ended March 31, 2023 | |
| FY ended March 31, 2022 | |
| FY ended March 31, 2021 |
ORIX Corporation Water Usage and Waste Disposal Volume
- Water Usage
| FY ended March 31, 2023 | FY ended March 31, 2024 | FY ended March 31, 2025* | |
|---|---|---|---|
| Water withdrawal | Approx. 273,000m3 | Approx. 282,000m3 | Approx. 110,000m3 |
| Rainwater | Approx. 2,000m3 | Approx. 2,000m3 | Approx. 6,000m3 |
| Water discharge | Approx. 272,000m3 | Approx. 280,000m3 | Approx. 110,000m3 |
| Calculation Period | From April 1 to March 31 each fiscal year |
|---|---|
| Calculation Scope | ORIX Corporation |
| Calculation Method |
|
* Tenant usage: From the fiscal year ended March 31, 2025, we have deducted water usage of third-party tenants occupying properties owned by ORIX Corporation. Figures before deduction of applicable usage were water intake of 229,000 m3 (of which 6,000 m3 is rainwater) and water discharge of 228,000 m3.
- Waste Disposal Volume
| FY ended March 31, 2023 | FY ended March 31, 2024 | FY ended March 31, 2025 | |
|---|---|---|---|
| Disposal volume | 302 tons | 353 tons | 291 tons |
| Calculation Period | From April 1 to March 31 each fiscal year |
|---|---|
| Calculation Scope | ORIX Corporation's industrial waste*1
*1 The waste subject to calculation is the industrial waste generated from business activities as defined in the Japanese law “The Waste Management and Public Cleaning Act”, such as cinder, sludge, waste oil, waste acid, waste alkali, waste plastics and other specified waste. |
| Calculation Method |
*2 A document describing the type and quantity of industrial waste that, under the Waste Management and Public Cleaning Act. |

- You need Acrobat Reader to view this site. If you have not installed one Adobe®Website
 you can download for free from this link.